First prototype: SnapHunt Bingo is making progress
This is the second part of a three part blog post about the game project "SnapHunt Bingo" which im developing with three other university students as part of our obligatory software project.
The development of our game “SnapHunt Bingo” is making progress. All the important screens of the app - login screen, main menu, lobby, game board and the evaluation screen - are now present and some of them are already fully functional. You are now able to go through the different stages of the game. The backend has also made a lot of progress but the connection between the frontend and the backend hasn't been fully carried out yet.
How the game looks and what works
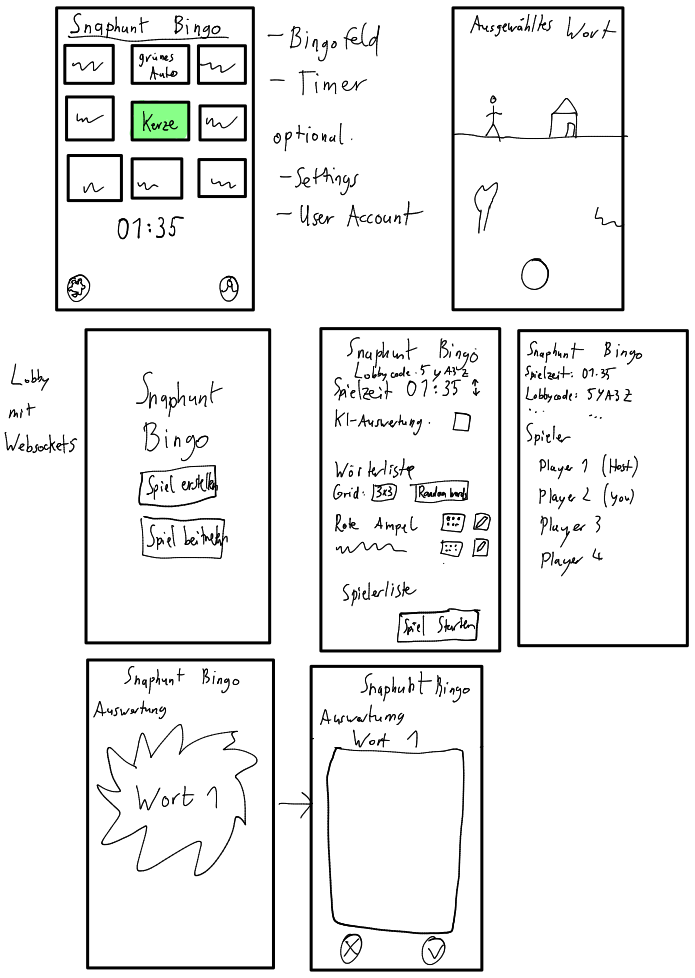
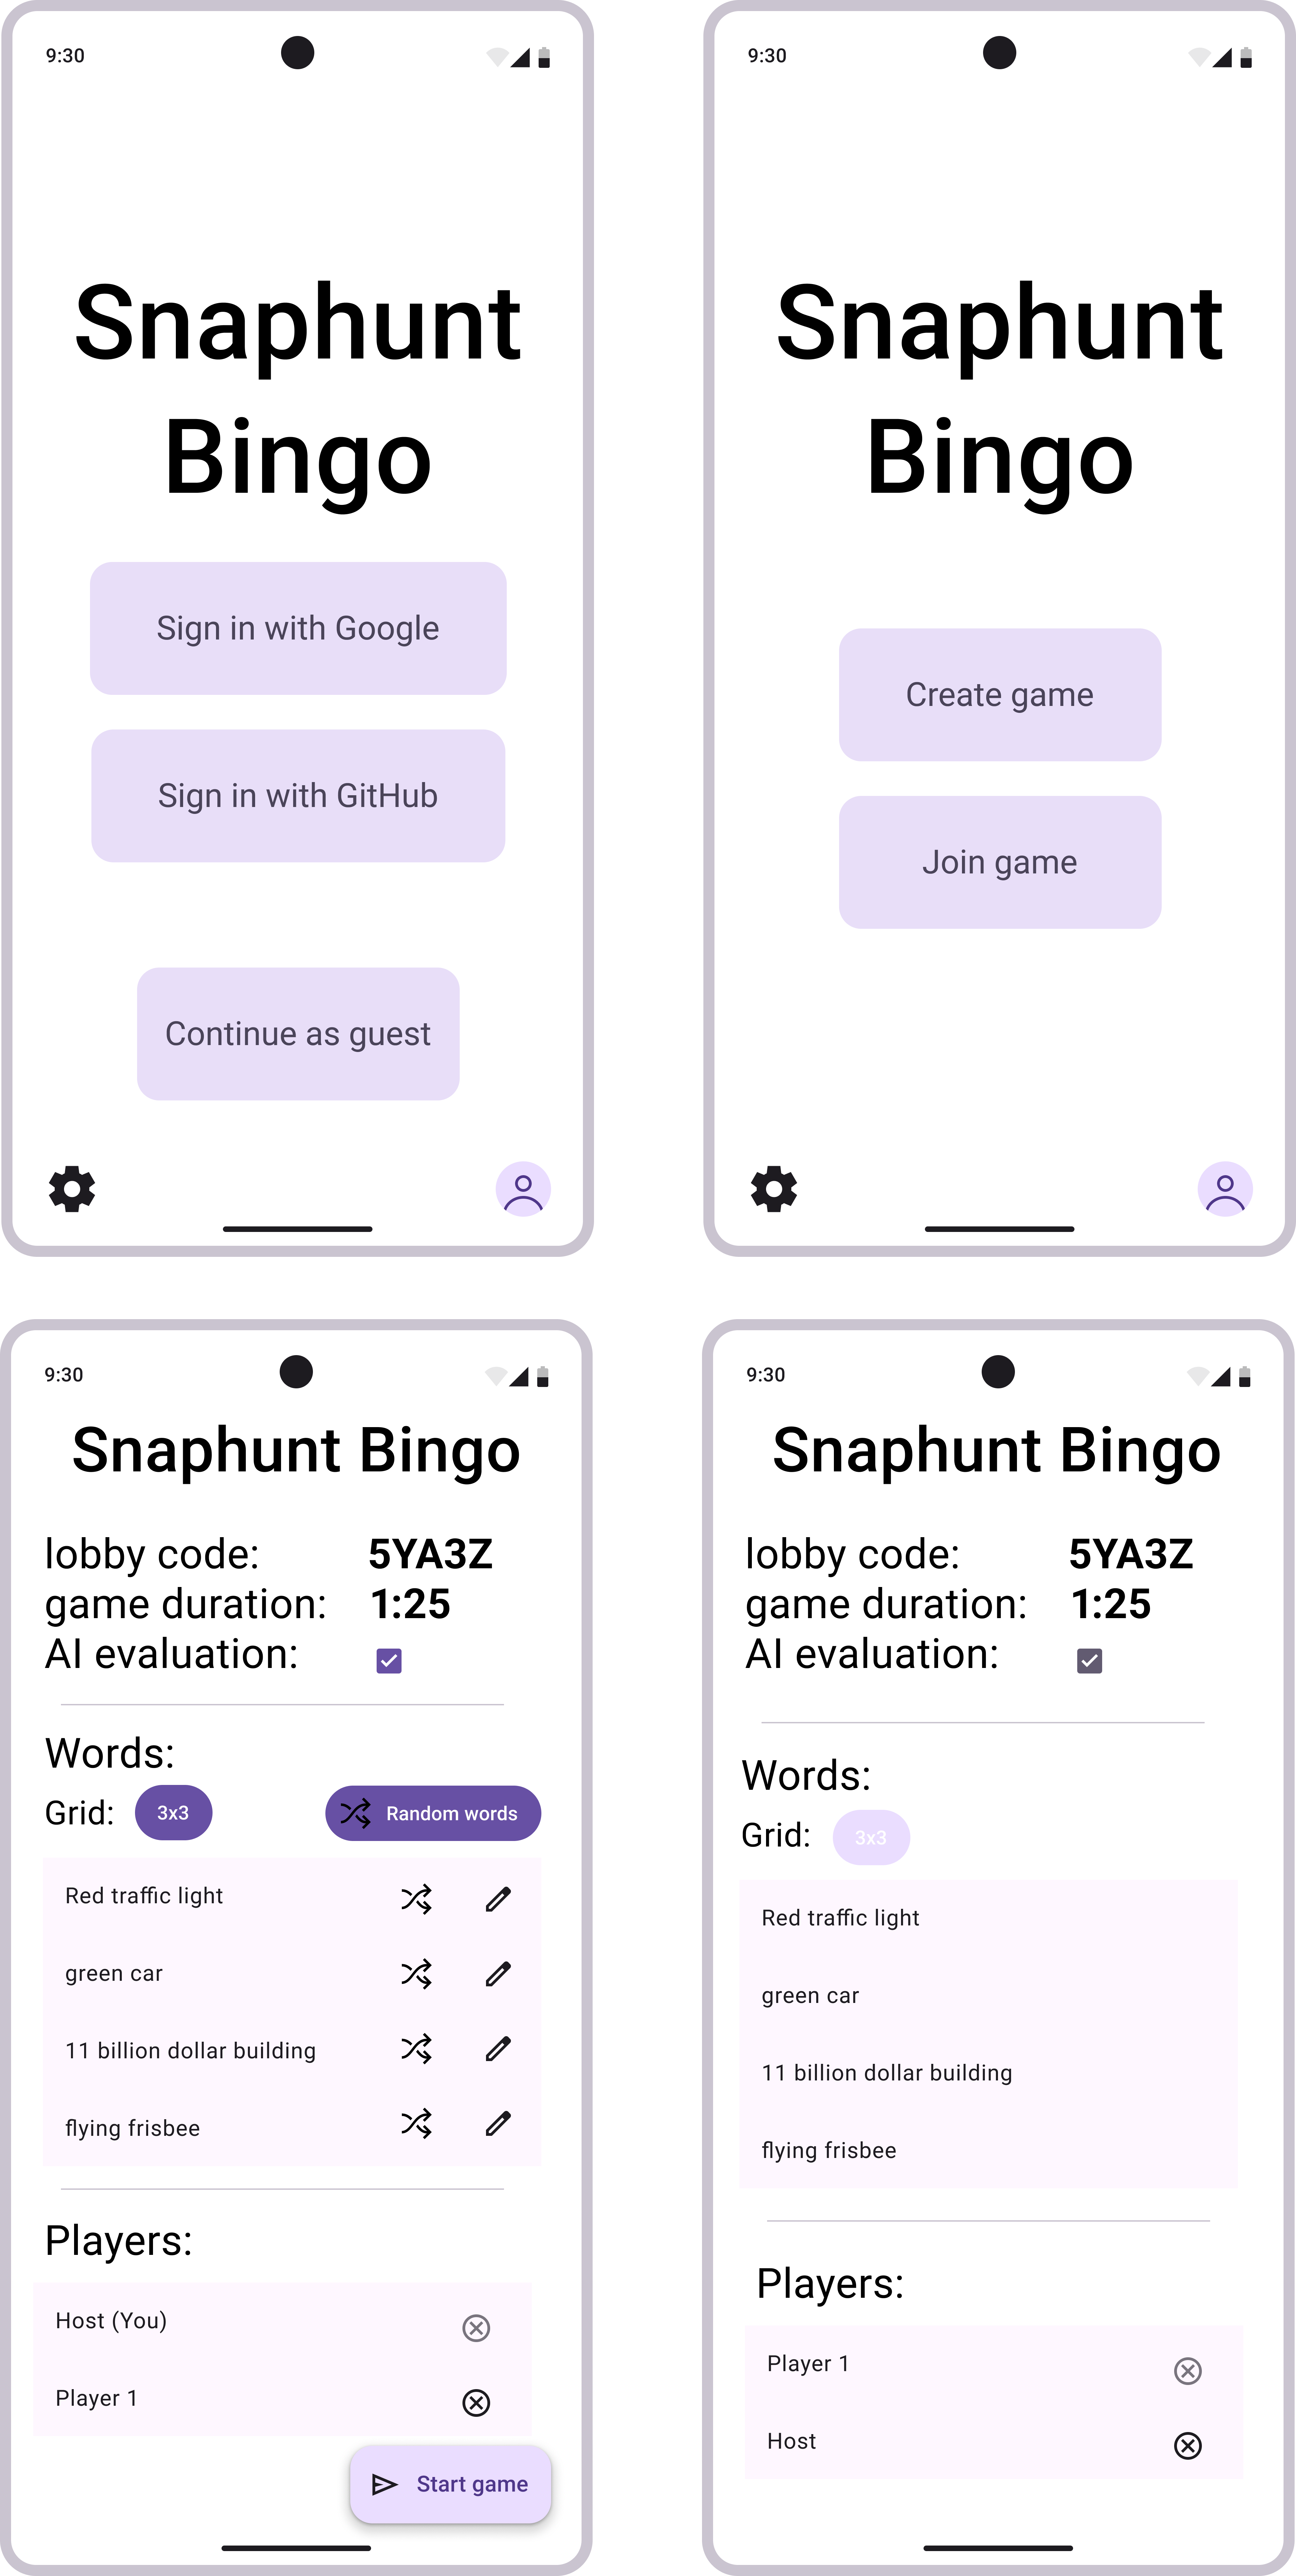
To test the game you first have to install the .apk. When you open the app you are greeted with a login screen. On this screen you can choose to login with your Google Account or choose to play as a guest. The login functionality is the first that has a connection to the backend and thus is fully functional.

After you login you get redirected to the main screen. There you can either create or join a game. The logic for joining a game is not implemented yet, so for now our proof of concept is only a single player experience. When you create a game, you'll get to the lobby screen. On that screen you can make some settings like enabling the AI integration or removing words/players. These are still static data only saved in the frontend so changing them won’t actually change anything.

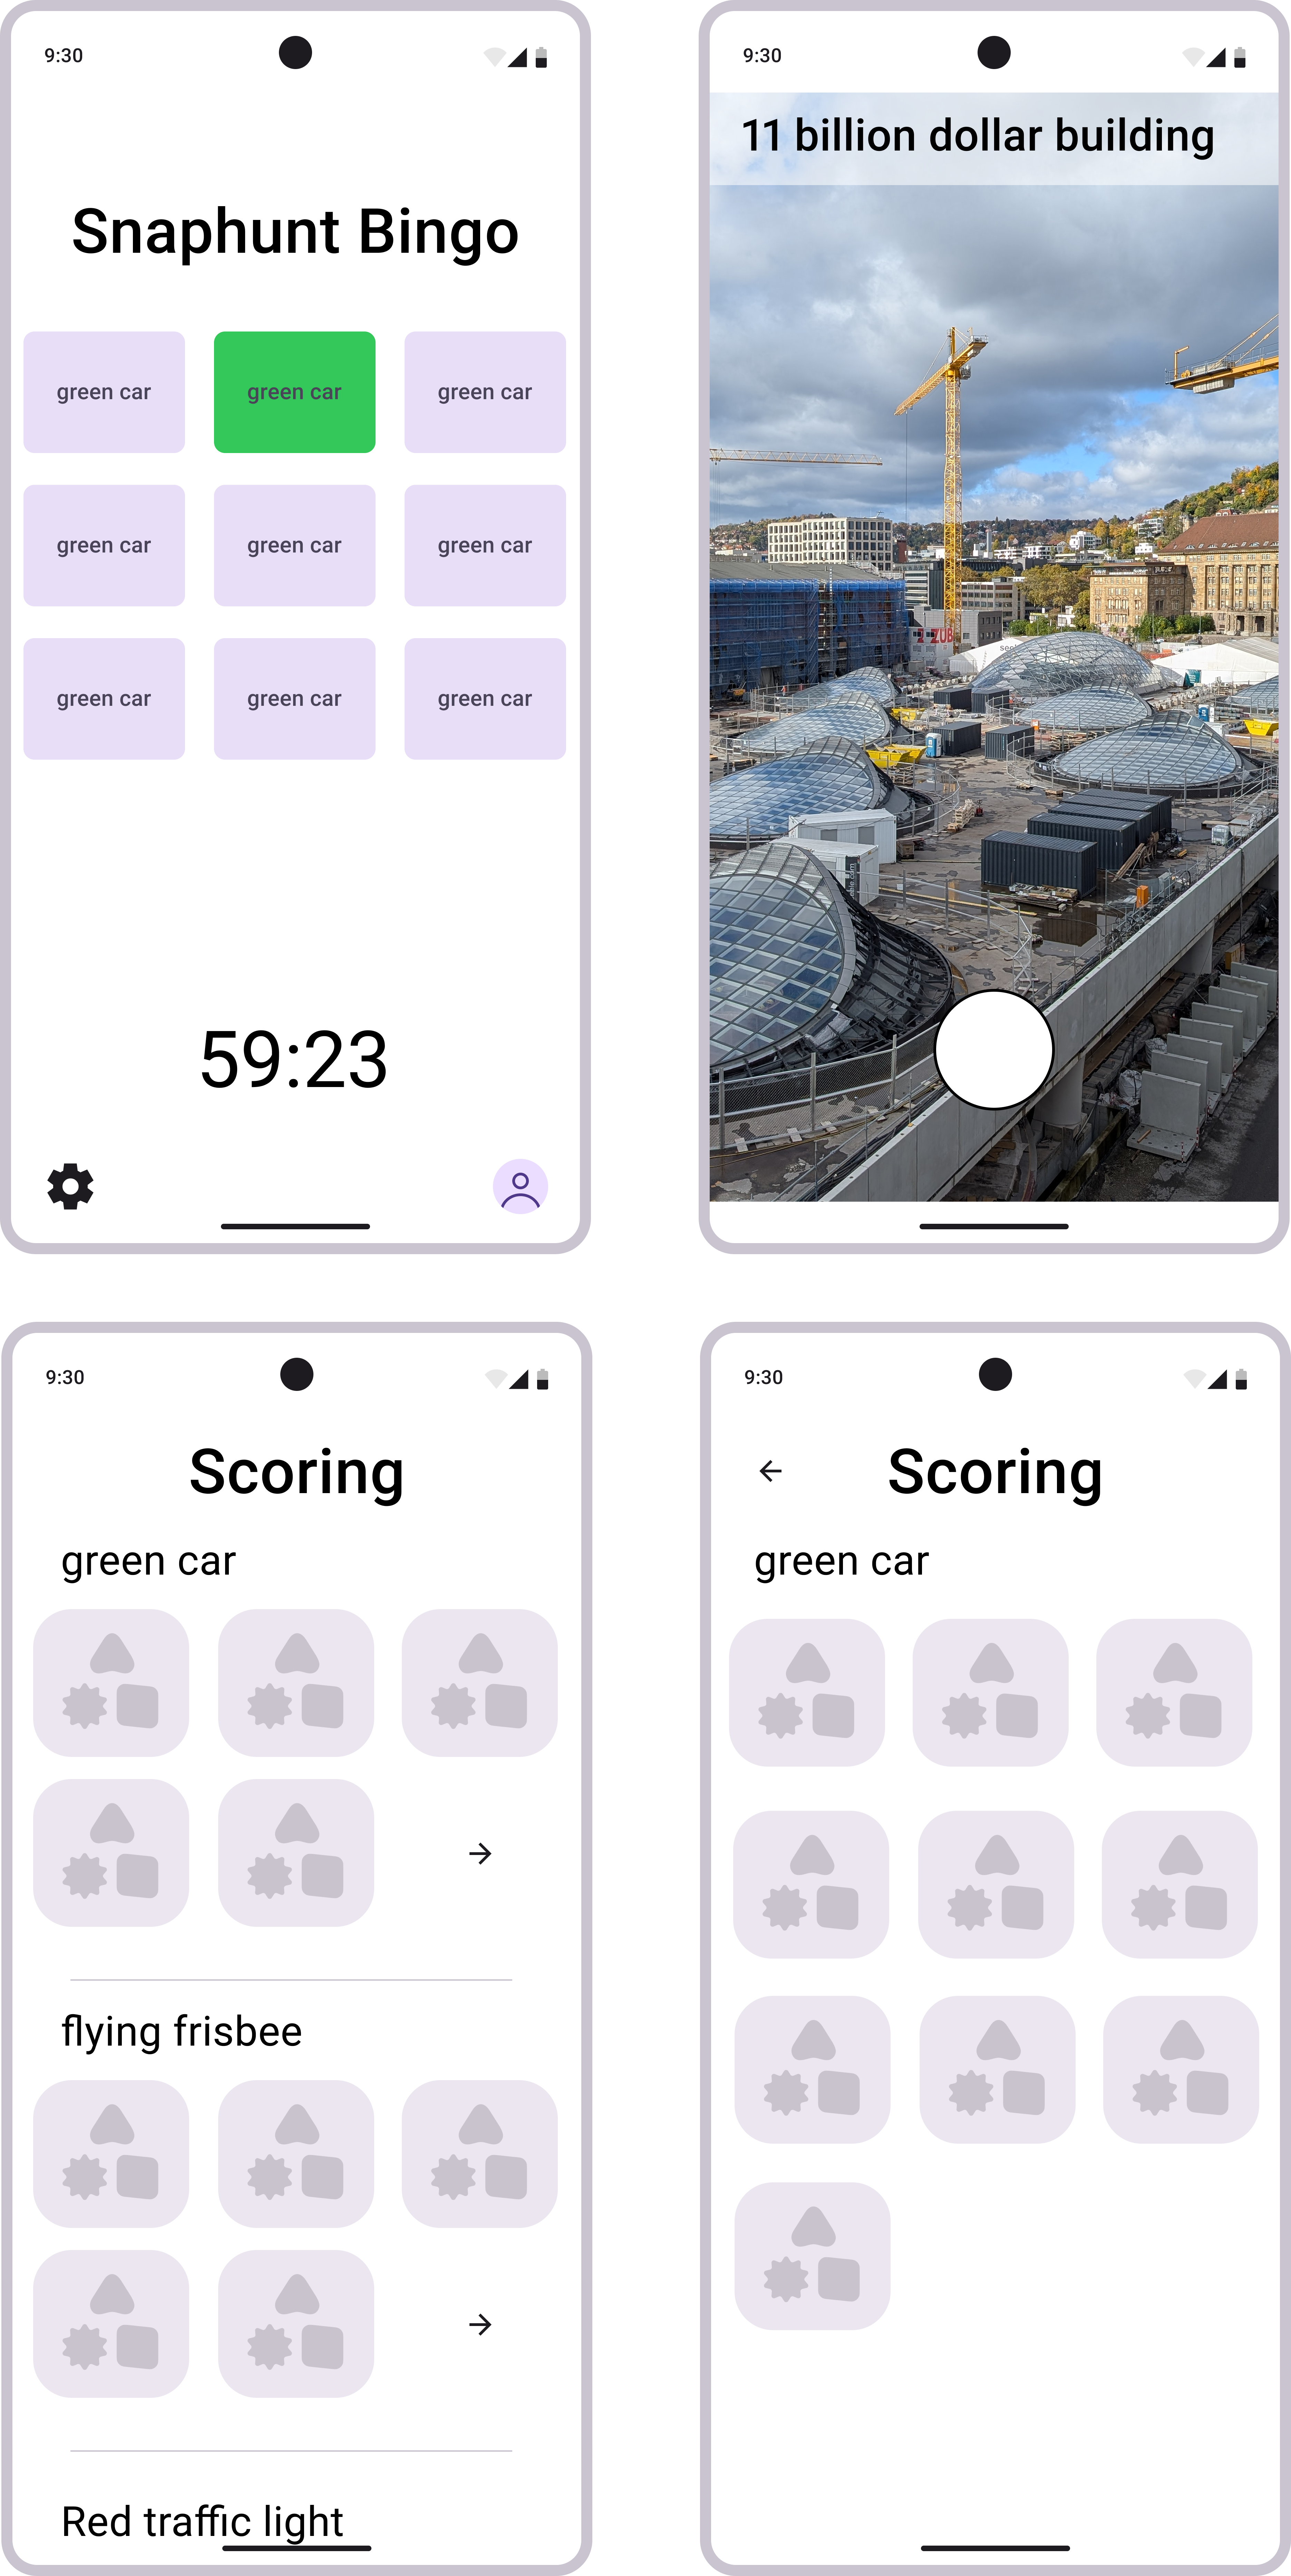
Once you start the game you'll see the game board with your bingo field and a timer running down. You can click on the words and get to a camera view where you can snap a picture. For now the picture is only stored on your device and not sent to the server. You can see the picture on your bingo card where once the text was.
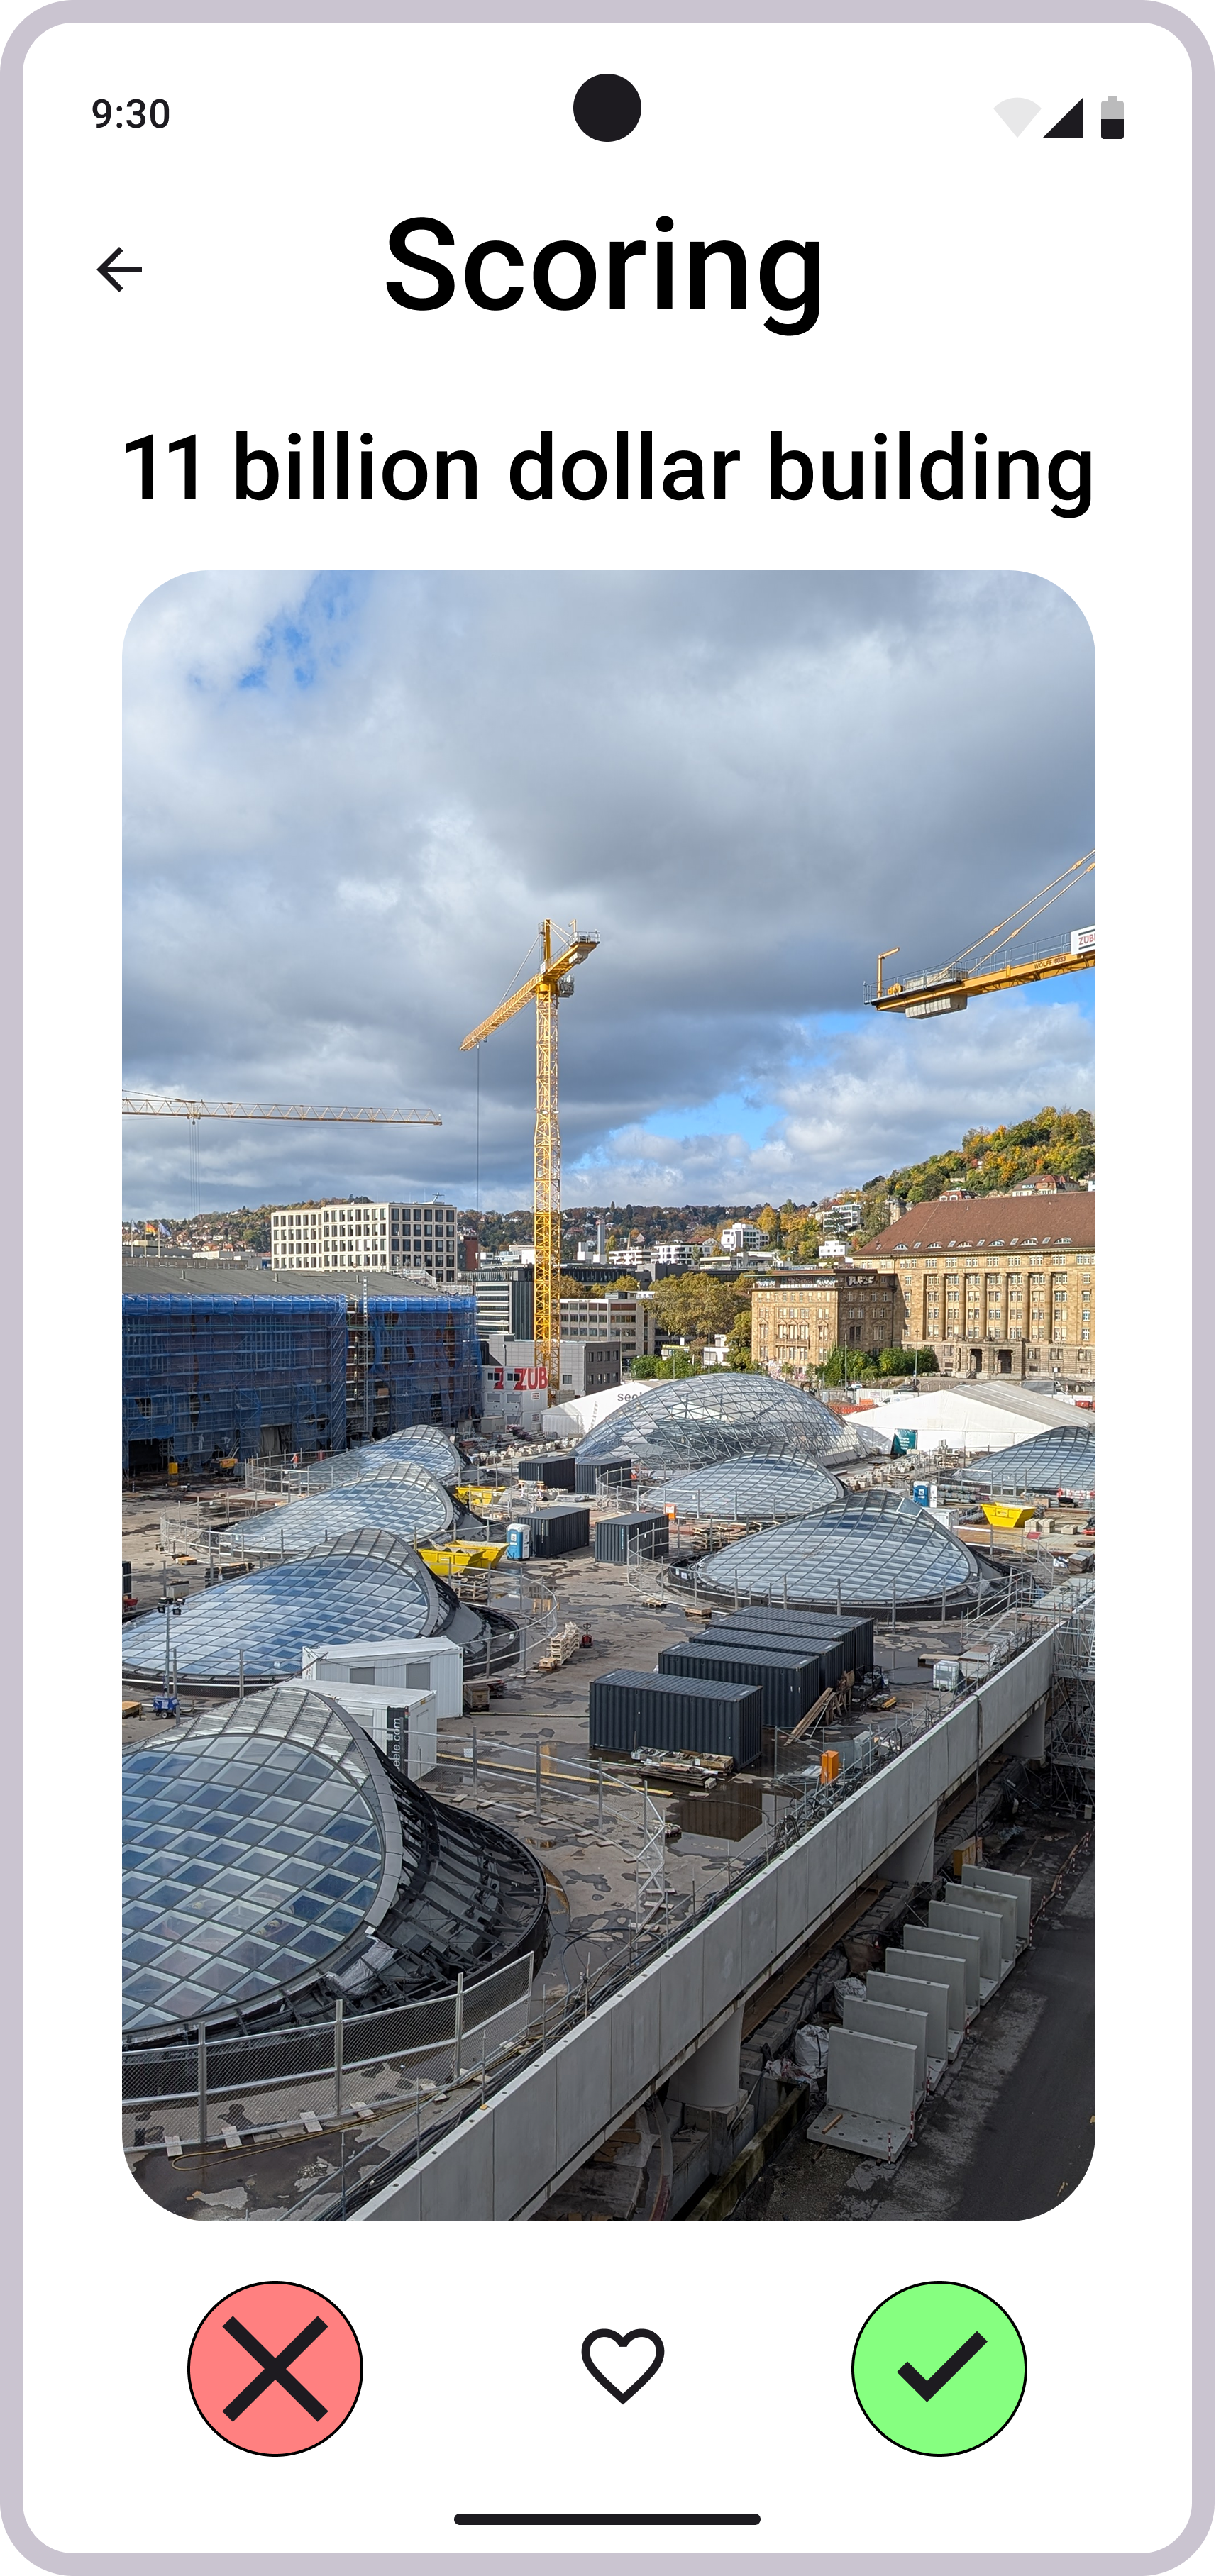
In the end you can go the evaluation screen. For now it is filled with random stock footage but it shows how it’ll look like in the finished game.

Even though there is no multiplayer yet playing the game at the HdM made some fun:

Frontend Update
We have already made significant progress on the frontend of our project since the last blog post. One of the first things we did was deciding on an architectural pattern. The Flutter documentation recommends the use of the MVVM pattern. As beginners in Flutter we did a lot of mistakes while trying to implement this pattern - just as we expected. For example, we intended to have the view for the guest login and the google login with the same data behind it, so we can use the created user object in the whole application. However, a View Model should have a one-to-one relationship with its corresponding view.
At first we ignored this issue, but as similar problems occurred repeatedly, we decided to introduce a dedicated repository layer for data handling. With this change we also completely reworked our folder structure. This is the next big topic in our queue. The next picture shows an example of the architecture of our frontend:

As for the thought process behind the different views: We split the different views evenly between the two frontend developers. At first, we tried implementing the views completely with their respective view models and services. However, since we needed a first demo before Christmas, we decided to build a complete gameplay loop as a client-side application. The login views were the first to be fully completed and are currently the only ones connected to the backend. The other views only contain the basic logic and layout of them.
To make the demo a bit more realistic we tried to contain some information from the other views for example the selected playtime. We also thought about using the pictures that were taken in the evaluation, but decided not to because this would work completely different to our final version where we will push the pictures to the backend while playing and later fetch everything again. Implementing a purely client-side solution for this did not make sense to us, as it would be discarded once the backend integration is complete.
Backend Update
Since the last developer blog we have focused on building the foundation of our backend. The Django project is now running and we have integrated the Django REST Framework for API development and prepared Django Channels for real-time communication. Redis is set up as the message broker and the ASGI server Daphne is ready for WebSocket support.
We implemented the lobby features, allowing players to create a lobby, join, view details, and start a game. In addition we developed the Game model, which stores all essential settings such as duration, word list, grid size and game mode. The main endpoint POST /api/lobby/game/create/ is complete – it validates the input (e.g., exactly 9 words), takes the players from the lobby, and creates a new game.
A good application needs secure authentication so we implemented a safe way for users to create a account. User now can login via Google and as a guest. The guest login was important for us as we want to set the game entry barrier as low as possible. The login itself is quite boring as we use the basic Google API. For the guest login we basically create a user with the name the users puts in and we create a random email address. Both authentication versions create a refresh and access token.
Testing the app was a bit tricky because Google requires a "key" from the .apk file to verify the address where tokens are sent. Since the backend team isn’t familiar with Flutter, we struggled to figure out how to retrieve the token. To make matters worse, only one person on the frontend team had access to the Google Cloud SDK, so we decided not to spend too much time troubleshooting the Google-related issues.
Another major challenge for the backend team was deploying the app to a server. For the first prototype, we wanted a functional server to handle frontend requests. One team member secured server access, and the backend team developed a Dockerfile to build a production-ready version of the app. The process went smoothly, with only minor issues like routing errors and file-copying mistakes in the code.
The AI Problem Part II
One thing that we kind of set aside was the AI picture classification. We haven’t had a server to test the AI performance problems we might encounter. We decided to first focus to make a functioning prototype and then to think about the AI feature and how to implement it. One big problem with the testing of different AI Models and Image classifier is the limited hardware availability for the testing. So one thing we need to consider is that local testing can only be made by one person in the backend team.
What’s next
There are still many things we plan to do to get a production ready game. These things include:
- Fully connect frontend with backend to achieve full multiplayer functionality
- Create working websockets, using daphne, for a smooth multiplayer experience
- Add a screen that shows the bingo fields of each player so you know who took which pictures and who got a bingo (full line)
- Create the game and scoring logic
- Add a score screen that shows the winner and how many points each player got
- Some bug fixes and improvements (for example the timer stops after the app has been idle for some time)
- Create a logo for the app’s main screen and the smartphone’s home screen
- Implement some sort of AI image classification
- Testing, testing and some more testing